Superbolts
Probably Overthinking It is available to predorder now. You can get a 30% discount if you order from the publisher and use the code UCPNEW. You can also order from Amazon or, if you want to support independent bookstores, from Bookshop.org.
Recently I read a Scientific American article about superbolts, which are lightning strikes that “can be 1,000 times as strong as ordinary strikes”. This reminded me of distributions I’ve seen of many natural phenomena — like earthquakes, asteroids, and solar flares — where the most extreme examples are thousands of times bigger than the ordinary ones. So the article about superbolts made we wonder
Whether superbolts are really a separate category, or whether they are just extreme examples from a long-tailed distribution, and
Whether the distribution is well-modeled by a Student t-distribution on a log scale, like many of the examples I’ve looked at.
The SciAm article refers to this paper from 2019, which uses data from the World Wide Lightning Location Network (WWLLN). That data is not freely available, but I contacted the authors of the paper, who kindly agreed to share a histogram of data collected over from 2010 to 2018, including more than a billion lightning strokes (what is called a lightning strike in common usage is an event that can include more than one stroke).
For each stroke, the dataset includes an estimate of the energy released in 1 millisecond within a certain range of frequencies, reported in Joules. The following figure shows the distribution of these measurements on a log scale, along with a lognormal model. Specifically, it shows the tail distribution, which is the fraction of the sample greater than or equal to each value.
On the left part of the curve, there is some daylight between the data and the model, probably because low-energy strokes are less likely to be detected and measured accurately. Other than that, we could conclude that the data are well-modeled by a lognormal distribution.
But with the y-axis on a linear scale, it’s hard to tell whether the tail of the distribution fits the model. We can see the low probabilities in the tail more clearly if we put the y-axis on a log scale. Here’s what that looks like.
On this scale it’s apparent that the lognormal model seriously underestimates the frequency of superbolts. In the dataset, the fraction of strokes that exceed 10e7.9 J is about 6 per 10e9. According to the lognormal model, it would be about 3 per 10e16 — so it’s off by about 7 orders of magnitude.
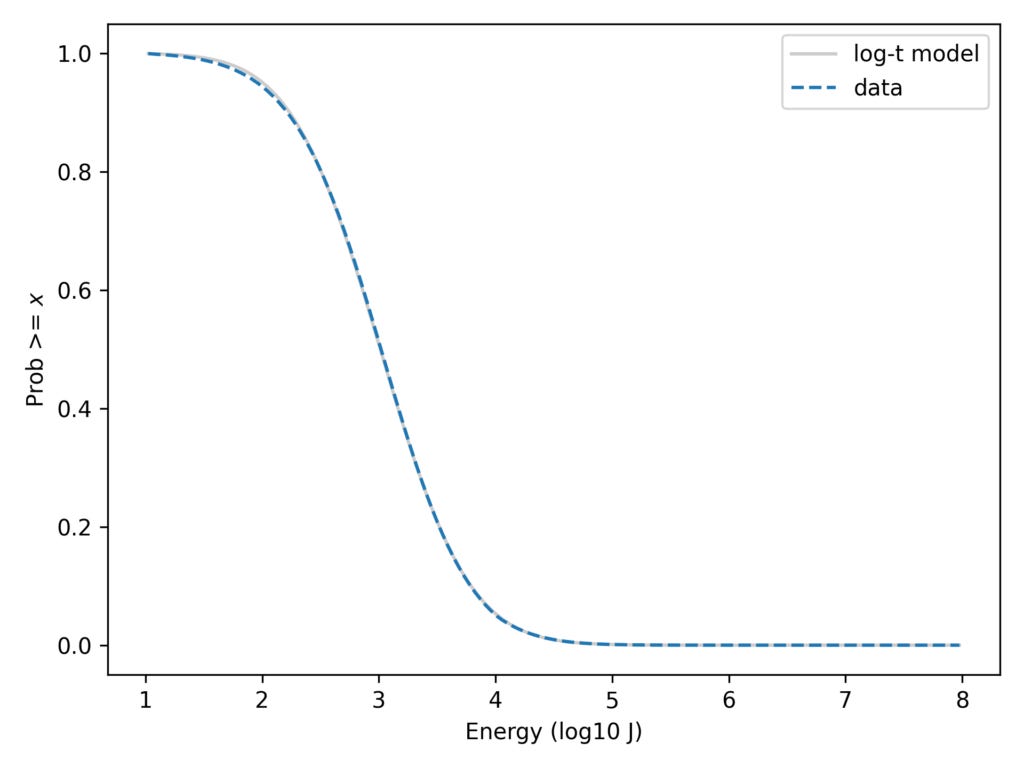
In this previous article, I showed that a Student t-distribution on a log scale, which I call a log-t distribution, is a good model for several datasets like this one. Here’s the lightning data again with a log-t model I chose to fit the data.
With the y-axis on a linear scale, we can see that the log-t model fits the data as well as the lognormal or better. And here’s the same comparison with the y-axis on a log scale.
Here we can see that the log-t model fits the tail of the distribution substantially better. Even in the extreme tail, the data fall almost entirely within the bounds we would expect to see by chance.
One of the researchers who provided this data explained that if you look at data collected from different regions of the world during different seasons, the distributions have different parameters. And that suggests a reason the combined magnitudes might follow a t distribution, which can be generated by a mixture of Gaussian distributions with different variance.
I would not say that these data are literally generated from a t distribution. The world is more complicated than that. But if we are particularly interested in the tail of the distribution — as superbolt researchers are — this might be a useful model.
The details of my analysis are in this Jupyter notebook, which you can run on Colab.
Thanks to Professors Robert Holzworth and Michael McCarthy for sharing the data from their paper and reading a draft of this post (with the acknowledgement that any errors are my fault, not theirs).


